
Driver-based forecasting serves as an intelligent budgeting solution which replaces ineffective outdated budgeting methods. The budget you create in Q3 becomes outdated by Q1. Finance teams rush to perform manual adjustments of numbers while business leaders operate without visibility.
The solution to this problem exists through driver-based forecasting. The model requires updates of financial numbers only through connections to actual business drivers which include units sold, production volume, raw material cost, FTEs or machine hours.
Read: Strategic Financial Planning: How to Plan for Success
The system automatically updates forecasts when drivers experience changes. The blog explains driver-based forecasting principles and its differences from traditional forecasting methods and its failure points and provides guidance on creating forecasting models which enable proactive team performance instead of reactive responses.
What is Driver-Based Forecasting
The financial planning method of driver-based forecasting connects financial metrics including revenue, costs and profit to operational activities which generate these results. The forecasting method constructs its predictions from fundamental business indicators such as sales volume and headcount and production output and conversion rates.
The forecast automatically updates when drivers change resulting in a planning model that provides better accuracy and responsiveness and transparency than static spreadsheets.
What Is a Driver in Forecasting?
A driver represents a measurable element which directly affects financial or operational results in forecasting. The revenue depends on the total number of deals and the size of each deal. Labor cost depends on headcount and average salary.
Drivers can be:
- Internal – inputs you control (e.g., marketing spend, number of FTEs)
- External – inputs you react to (e.g., commodity prices, exchange rates).
The implementation of drivers lets finance teams predict both the expected outcomes and the underlying causes which leads to enhanced decision-making and scenario planning capabilities.
A few examples:
Revenue = number of units sold × average price per unit
Labor cost = number of employees × average salary × hours worked
COGS = production volume × cost per unit
Transport costs = number of deliveries × average distance × USD/mile per hour
Drivers can be internal (things you control, like sales team size) or external (things you react to, like raw material prices). Either way, they give you a much clearer picture of what’s likely to happen – not just what happened before.
Without them, forecasting is just guessing with better formatting.
Read: How to Handle Variable Expenses for More Accurate Forecasts
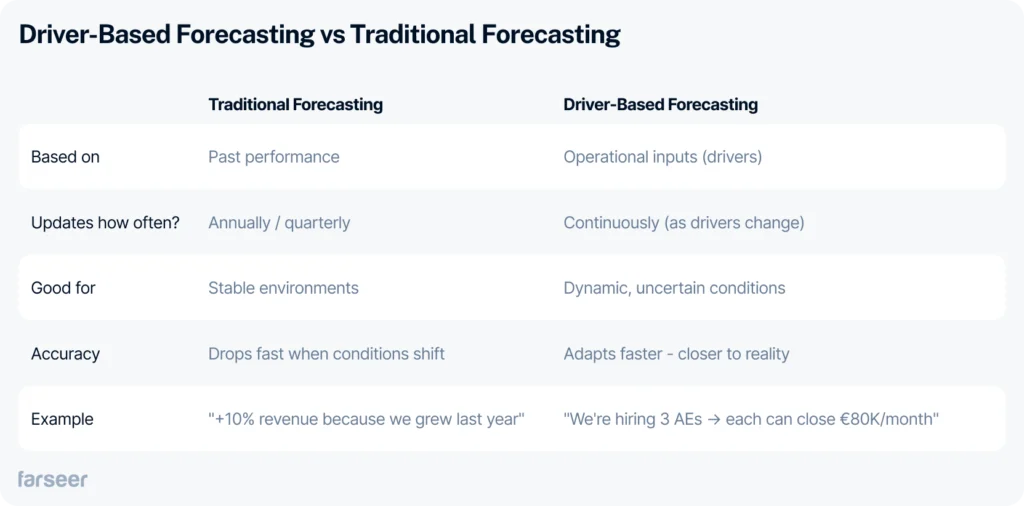
Driver-Based Forecasting vs Traditional Forecasting
Most forecasts are just dressed-up trendlines.
You take last year’s numbers, maybe apply a percentage increase, and call it a forecast. Sometimes it works. Most times it doesn’t – especially when things start shifting mid-year.
Driver-based forecasting flips the logic.
Instead of asking “What did we do last year?”, ask “What’s actually going to change this year – and why?”
Key Benefits of Driver-Based Forecast
Driver-based forecasting isn’t just more accurate – it changes the way your team thinks about planning.
Once you stop chasing the output and start modeling the inputs, three big things happen:
1. More accurate forecasts, faster corrections
You don’t wait until the quarter ends to realize you missed.
You can catch it early:
Incoming orders dropped? → Update volume assumptions
Headcount behind plan? → Adjust production capacity and labor cost
Supplier prices jumped? → Forecast gross margin impact before it hits the P&L
Your forecast doesn’t fall apart – it adapts.
Read more: How to Choose the Right Forecasting Tool for Rolling Forecasts
2. Planning aligned with operations
- Production knows that a 5% increase in machine uptime = 2,000 more units per month.
- HR knows how many new hires are needed to hit seasonal output.
- Procurement sees raw material costs rising and updates input prices.
Finance is no longer guessing – they’re planning with data that reflects what’s happening.
3. Less copy-pasting, more real planning
Instead of updating 18 Excel tabs manually, you work from one model.
When drivers change, the forecast updates automatically.
Want to run a quick scenario?
“What if we hire 2 more AEs in Q3?” – You’ll know the impact in second
4. Plans people actually understand
Driver-based models are logical. Everyone can see how the numbers were built – and where they can move the needle.
No more “finance sent us this number, but no one knows how they got it.” This mindset shift is what separates reactive forecasting from strategic planning – and KPMG’s driver-based planning guide breaks it down well.
How to Build a Driver-Based Forecast (in 4 Steps)
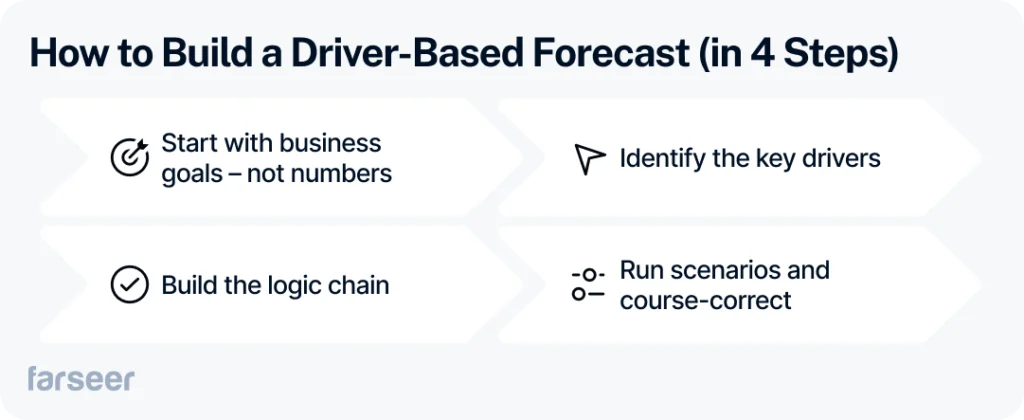
Driver-based forecasting isn’t magic. It’s structure.
Here’s how top-performing finance teams build models that reflect reality – and scale with the business:
Step 1: Start with business goals – not numbers
Before touching a spreadsheet, define what you’re solving for.
Are you targeting revenue growth, margin improvement, or cost control?
Example:
Instead of saying “We want to grow by 20%,” say “We want to grow revenue by expanding sales capacity and increasing conversion rate.”
That sets you up to model how things work.
Step 2: Identify the key drivers
Drivers are the levers you can pull – the things that cause the results.
Good drivers are:
- Controllable (e.g., sales headcount, pricing, conversion rates)
- Scalable (they respond predictably when you change them)
Assumptions support them (e.g., ramp time, churn, lead-to-close ratio).
Get both right, and the forecast will hold.
Need help identifying strong drivers?
Read more: FP&A Software – A Practical Guide for Finance Teams
Step 3: Build the logic chain
This is where the model comes to life.
For example:
- Manufacturing Machine uptime → Units produced → Revenue → Gross margin → Cash flow
- Telecom New customers → ARPU → Total revenue → OPEX → Net cash flow
- Retail Foot traffic → Conversion rate → Sales volume → Revenue → Inventory cost
Every driver should link to at least one financial outcome.
Use formulas or rule logic – not hardcoded values. And make sure your model updates when a driver changes. If it doesn’t, it’s not really driver-based.
Step 4: Run scenarios and course-correct
Once the model is live, use it.
Ask questions like:
- What happens if raw material prices rise by 10%?
- Can we meet EBITDA targets if machine downtime increases next quarter?
- What if labor costs go up due to a new union contract?
- How does a 5% drop in sales volume affect net margin?
This is where driver-based forecasting shines.
You stop guessing – and start making decisions with data.
Read more: Scenario Planning – How to Prepare Your Business for Uncertainty
Common Mistakes to Avoid in Driver-Based Forecast
Using too many drivers: If everything becomes a driver, nothing truly drives the forecast. Overcomplicating your model with dozens of weak drivers only adds noise. Focus on what actually moves the needle – sales volume, conversion rate, churn, etc.
Forgetting to link drivers to real financial impact: Tracking units produced, employee hours, or customer churn is fine – but if those drivers don’t translate into concrete changes in your P&L, balance sheet, or cash flow, they don’t belong in your forecast.
Relying on gut instinct, not data: Driver values need to be based on real data – historical trends, KPIs, or business assumptions you can defend. If you’re just guessing, you’re not forecasting – you’re storytelling.
Skipping collaboration with other teams: Sales, HR, ops – they all own part of the picture. If finance builds the model in isolation, adoption fails. Forecasting needs to be a shared process to work.
Trying to do it all in Excel: Spreadsheets hide logic, break easily, and slow you down. Driver-based models quickly become too complex to manage manually.
Read: Why Enterprise Planning is Broken – and How to Unbreak It.
How Violeta Scaled Forecasting Across 30 Brands
The company of Violeta which operates as the largest hygiene product manufacturer in the Adriatic region experienced Excel-related drowning before adopting driver-based forecasting. The sales and finance teams at the company needed to perform manual planning for 30 brands and hundreds of SKUs and three countries’ key accounts.
The forecasting environment at Farseer became possible through direct system connections between their ERP and BI systems which enabled Violeta’s team to create driver-based models that used real-time inputs from SKUs per distributor and pricing tiers and customer-specific rebates. The team began using actual revenue drivers for modeling instead of making guesses or using last year’s plan.
The system distributes sales targets automatically to SKUs while calculating rebate effects and modifying margin expectations for the entire portfolio when a planner sets a sales goal for a major client.
The result?
- Weeks saved on annual planning cycles
- Automated profitability calculations for every client and product line
- Real-time dashboards showing P&L shifts as plans change
The company now uses collaborative planning and forecasting through live data and instant logic adaptation instead of planning in separate silos and sending Excel files by email.

Forecast What You Can Control
Forecasting doesn’t have to be a guessing game.
When you build your plans around real business drivers – not just historical averages – you get a model that actually reflects how your company runs. It reacts to change. It explains why numbers move. And it gives you levers to pull when things shift.
Driver-based forecasting helps you plan smarter, faster, and with more confidence – because you’re not just predicting outcomes. You’re planning the inputs that create them.
Want to see how it works in practice?
Explore our guide on rolling forecasts or book a live demo to see Farseer in action.