
Most discussions treat EBITDA and net income as if they describe the same kind of profitability. They don’t. That simplification distorts decision-making. These measures answer different strategic questions: EBITDA tests operational momentum, while net income reflects the company’s full economic reality after capital structure, taxes, and non-core items.
Read more: A Complete Guide to Financial Statement Analysis for Strategy Makers
EBITDA and net income are not alternatives to one another. They sit at different stages of the value chain. Misread them, and you optimize one part of the system while destabilizing another.
What Each Metric Represents
EBITDA:
What it does capture is operating trajectory. It is helpful for comparing businesses with different capital structures or spotting changes in core performance.This explains why private equity favors it, even though it often masks structural weaknesses rather than solving them. Because it excludes both interest and reinvestment, EBITDA cannot describe liquidity, solvency, or runway.
Net income
When leverage, covenants, dilution, or investor payouts matter, net income becomes far more relevant than EBITDA. It shows whether the company is covering its obligations, not just performing well on paper.

The Hidden Variables That Change the Meaning of Both Metrics
CapEx intensity and the reinvestment cycle
Some businesses can delay reinvestment for years. Others decay the moment they stop spending. This single variable determines whether EBITDA is even usable.
Where EBITDA collapses:
- Airlines: maintenance CapEx exceeds depreciation by design.
- Retail: store refresh cycles make EBITDA unusable without normalizing reinvestment
- Manufacturing: machinery obsolescence makes EBITDA irrelevant for solvency
Where net income misleads the other direction:
- Pharmaceuticals: long development cycles distort net income for years.
- Biotech: R&D expensing means net income understates long-term value creation.
The reinvestment cycle determines which metric carries more informational weight.

Operating leases and the IFRS/US GAAP split
The 2019 lease accounting changes created one of the most under-discussed traps in financial analysis.
Under US GAAP: rent remains fully expensed → EBITDA deducts the entire amount.
Under IFRS: rent is split into “depreciation” and “interest” → EBITDA ignores rent completely.
The result is predictable: IFRS EBITDA looks artificially stronger, making cross-border comparisons unreliable unless adjusted. Analysts who miss this point routinely overvalue European companies and undervalue US businesses in lease-heavy sectors.
The role of non-core activities
Net income gets polluted by:
- one-time gains and losses
- asset write-downs
- tax credits
- discontinued operations
EBITDA has the opposite problem:
It strips out everything non-core, which sounds useful until a company consistently destroys value in those “non-core” areas. EBITDA will never show it. Side businesses, loss-making subsidiaries, and restructuring cycles can erode equity while EBITDA appears stable or improving.
These structural distortions influence how CFOs actually use the metrics in practice.
How CFOs Use These Metrics in Decision Making
EBITDA for assessing operational control
EBITDA is the lens for understanding whether the core engine is functioning as intended.
- Pricing power: reveals whether revenue scales faster than variable costs.
- Unit economics: strips away financing noise to expose contribution margins.
- Cost discipline: highlights whether operating structure is tightening or drifting.
- Runway extensions: shows how far adjustments to opex can realistically go.
This is the metric for steering day-to-day performance, not forecasting solvency.
Read Revenue vs EBITDA: Which Metric Should Drive Your Strategic Planning

Net income for assessing investor returns and resilience
Net income is reserved for decisions where obligations, dilution, and long-term value matter.
- True profitability: captures the full economic impact of financing and reinvestment.
- Earnings quality: separates sustainable performance from accounting artifacts.
- Tax planning and leverage strategy: reflects the real cost of structure.
- Incentives: anchors bonus schemes and governance mechanisms that require a complete picture.
This is the metric for evaluating durability, not just momentum.
The Misunderstanding That Causes the Worst Decisions
Misalignment between EBITDA and net income creates forecasting failures because teams optimize while ignoring obligation risk. The result is predictable: plans look viable in EBITDA terms but collapse once debt service, tax cycles, or reinvestment demands appear.
The persistence of bad metric usage is not an intellectual problem, but an incentive problem.
Who benefits from EBITDA?
- Lenders: EBITDA places their claims first and paints a more forgiving picture of financial health.
- Private equity: Higher EBITDA supports higher valuation multiples and cleaner deal narratives.
- Executives with adjusted-EBITDA bonuses: Stripping out “non-core” items conveniently improves compensation outcomes.
Who benefits from net income?
- Equity investors: Net income supports dividend capacity, EPS, and long-term value arguments.
- Boards and auditors: It reflects the full economic burden of capital structure and governance.
- New management teams: Net income allows them to blame predecessors by highlighting write-downs and non-core losses.
The effect is straightforward: Different groups push different metrics because the choice reallocates risk and changes whose story appears credible. Metric selection becomes a negotiation.
Recognizing these incentives matters because it explains why EBITDA is defended even when it obscures liquidity risk, and why net income is dismissed the moment it becomes inconvenient.
How AI-Driven FP&A Tools Change Interpretation
In spreadsheet-driven environments, the divergence between EBITDA and net income is usually discovered only after decisions have been made, because the underlying drivers live in disconnected files and update on different timelines.
AI-driven FP&A tools remove that gap. They make the divergence between operational performance and economic obligation immediately visible.

Key shifts:
- Real-time ingestion of actuals ensures EBITDA and net income update the moment cash, interest, or tax movements occur. No waiting for month-end closes.
- Driver-based modeling recalculates both metrics automatically when pricing, headcount, FX, or churn assumptions change. Teams see instantly which levers move EBITDA and which impact net income.
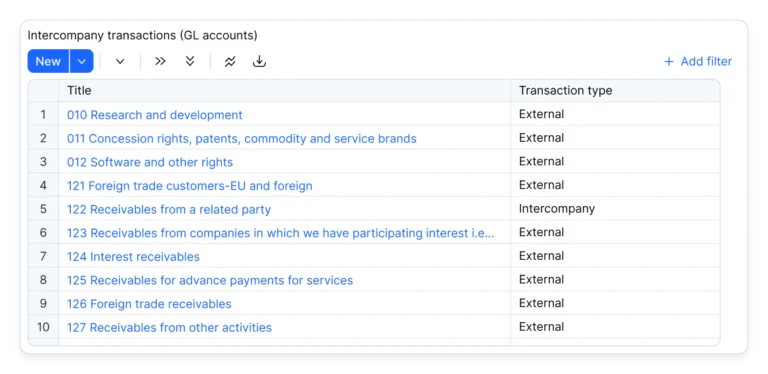
- Automated multi-entity consolidation brings leverage, tax positioning, and intercompany eliminations into a single model instead of being maintained in separate offline files.
- Scenario branching exposes how interest costs, CapEx cycles, or covenant thresholds shift under best-case and worst-case conditions – without rebuilding templates for each version.
The result is a planning environment where discrepancies between EBITDA and net income are surfaced, quantified, and acted on immediately. CFOs get earlier warnings, more reliable forecasts, and fewer surprises at board level.
The Wrong Question Has Been Asked All Along
The only useful question is what decision you are trying to make and which metric aligns with that decision. EBITDA is a measure of operating momentum; net income reflects the company’s obligations and economic constraints. They answer different questions, and both are required to understand performance and risk.
When used correctly, the two metrics form a coherent view: how the business runs, how it must be financed, and where pressure will emerge. The problem is not the formulas. It is the lack of a consistent framework for interpreting them.
Modern FP&A teams improve not by adding new metrics, but by applying existing ones with precision.