
Not all revenue growth is created equal.
Was it because you sold more? Charged higher prices? Or changed your product mix?
That’s where Price-Volume Variance (PVV) analysis plays a key role. It’s one of the most insightful ways to explain why your actual results differ from plan or forecast.
But building a proper PVV model from scratch in Excel can be tricky: formulas break, dimensions multiply, and a small error can flip your analysis upside down.
To help you get started quickly, we’ve created a free Price-Volume Variance Excel Template that’s easy to use, fully editable, and ready to plug in your own data.
Download the Free Price and Volume Variance Template
What Is a Price-Volume Variance Analysis?
Price-Volume Variance (sometimes called price-volume-mix analysis) breaks down your revenue variance into its three main components:
- Price Variance – shows the effect of selling at a higher or lower price than planned.
- Volume Variance – shows the impact of selling more or fewer units than planned.
- Mix Variance – shows how changes in product or customer mix affect total revenue.
Together, these insights reveal what’s really behind your topline changes: whether it’s a pricing strategy paying off, a shift in demand, or simply the product mix working in your favor.
Example
Let’s say your total revenue grew by €500K compared to budget.
A Price-Volume-Mix analysis might reveal:
- +€200K from selling 3% more units (volume variance)
- +€250K from higher prices (price variance)
- +€50K from a more profitable product mix (mix variance)
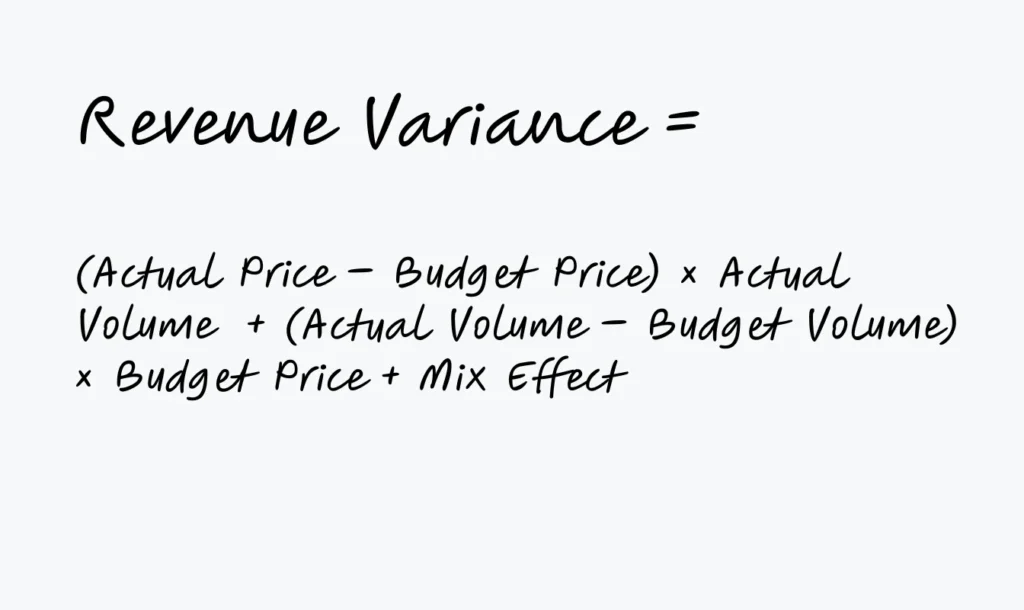
Formula summary:
Instead of just knowing that your sales increased, you’ll know why – this is the essence of good financial storytelling.
Why Price-Volume Analysis Matters
Variance analysis is one of the most powerful techniques in financial planning.
Here’s why finance teams rely on PVV every month:
- Isolate the right drivers – distinguish between growth from pricing versus true volume expansion.
- Guide better decisions – adapt pricing, discount, and sales strategies based on facts, not assumptions.
- Improve forecast accuracy – feed real-world insights into your next rolling forecast or reforecast.
- Support business partnering – explain results to non-finance stakeholders clearly and visually.
- Spot margin opportunities – identify which products or markets deliver the biggest impact.
In short, PVV helps finance teams move beyond static reporting to actionable insight.
Read: 6 Variance Analysis Software Options for Finance Teams
What’s Inside the Free Excel Template
This ready-to-use Price & Volume Variance Excel Template includes everything you need to understand how pricing and quantity changes impact your revenue — month by month, and overall.
Here’s what you’ll find inside:
- Pre-filled structure with monthly Plan and Actual data
Input your own monthly figures for price, volume, and discounts — the model automatically updates all totals and variances. - Key financial drivers pre-built
The template includes the full logic behind revenue formation:
Quantity, Gross Sales Price, Discounts, Net Price 1 & 2, Gross Sales, and Net Sales. You’ll instantly see how each of these drivers affects your total sales performance. - Automatic price and volume variance calculations
The sheet computes the difference between Plan and Actual for both price and volume, revealing exactly how much of your revenue variance comes from each driver. - Visual-ready outputs
With all monthly results structured in columns, you can easily plug the data into charts or dashboards (Excel or BI) for clear visualization of trends over time. - Annual summary section
Totals at the bottom automatically consolidate results across all months — perfect for quarterly or year-end variance reviews. - No macros or complex setup
Just open, input your Plan and Actuals, and start analyzing. Everything runs on simple, transparent Excel formulas.
How To Use the Template
The template is already pre-built with all necessary calculations — you only need to input your own plan and actual figures. Here’s how to get the most out of it step by step:
- Enter your monthly Plan data
Start by adding your planned quantities and prices for each month in the Plan section. You can adjust the months, add more products, or rename categories to match your reporting structure. - Fill in your Actual results
In the Actual columns, enter the real performance data — actual quantities sold, realized prices, and discounts applied.
As soon as you do this, all Net Prices, Gross Sales, and Net Sales lines update automatically. - Review the calculated Price and Volume Variance
The template automatically computes how much of the difference between Plan and Actual revenue comes from price changes (price variance) and quantity changes (volume variance).
You’ll see clearly whether the performance gap was driven by pricing strategy, sales volume, or discount policies. - Analyze trends across months
Because the model spans the entire year (January–December), you can quickly identify patterns — for instance, when pricing power improved or when lower sales volume offset higher unit prices. - Use totals for variance summaries
The bottom rows show cumulative annual figures, giving you a consolidated view of the full-year plan vs. actual performance and total variance. - Visualize and present results
The clean monthly structure makes it easy to build charts in Excel — such as variance waterfalls or stacked bar charts showing price vs. volume contributions to total revenue change.
This helps you turn the data into insights you can share in management reports or presentations. - Adapt it to your business
Whether you sell products, services, or manage multiple markets, the logic stays the same — only your input data changes. You can duplicate the sheet for different categories, add dimensions, or link it to a dashboard for automatic updates.
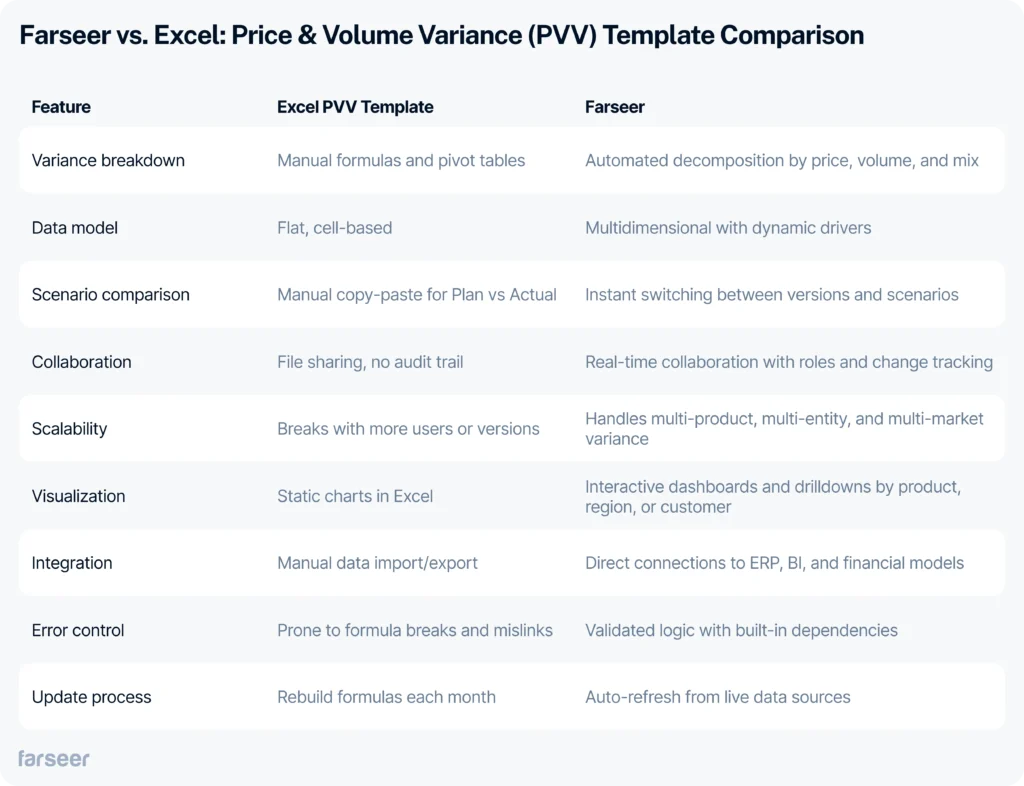
From Excel to Real-Time Automation
You still work with the same structure – monthly layout, inflow/outflow rows, forecast vs actual logic – but everything updates in real time. No version drift. No broken links. No delays.
With Farseer, you plan faster, track better, and focus on decisions instead of formatting.
If Excel has become the bottleneck, it’s time to move forward.
Done with spreadsheet workarounds?
Excel templates are great for quick insights, but maintaining them across multiple entities, currencies, or scenarios can quickly become a full-time job.
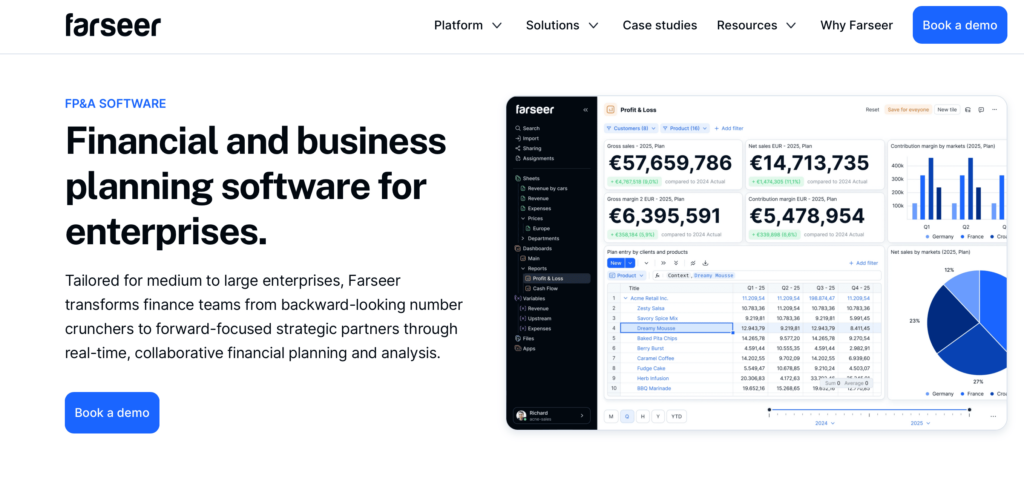
That’s where Farseer comes in.
With Farseer, variance analysis becomes automated, connected, and real-time:
- Pull actuals and budgets directly from your ERP or BI system.
- Run price, volume, and mix breakdowns across all your models.
- Drill down from total variance to individual products or cost centers – instantly.
- Share results with the whole team without emailing a single spreadsheet.
Stop spending time on manual data prep.
Start planning with precision and speed.
See How Farseer Automates Variance Analysis.