FREE CALCULATOR
IRR Calculator
IRR & XIRR Calculator
Enter your initial investment and cash flows to compute the Internal Rate of Return.
| Period / Date | Cash flow |
|---|
Results
Interpretation
Enter your cash flows and click “Calculate IRR” to see the result.
Notes & warnings
- IRR requires at least one negative and one positive cash flow.
How to Use the IRR Calculator
Using this IRR & XIRR Calculator is simple, even if you’re not a finance expert. Just follow these steps:
1. Enter your initial investment (CF₀)
This is usually a negative value, representing the upfront cost of the project or investment (e.g., -100,000).
2. Add your future cash flows
Enter the expected inflows and outflows for each period.
In IRR mode, periods are evenly spaced (e.g., yearly cycles).
In XIRR mode, you can assign exact dates to each cash flow for more precision.
You can add or remove periods depending on the length of your project.
3. (Optional) Enter a hurdle rate
The hurdle rate is the minimum acceptable return for your company or project. The calculator will automatically interpret whether your IRR is above or below this threshold.
4. Open “Advanced Options” if needed
Here you can:
Set a reinvestment rate for MIRR
Adjust calculation tolerance
Change the number of iterations for complex cash flow patterns
Most users won’t need to change these defaults.
5. Click “Calculate IRR”
The calculator will display:
IRR (Internal Rate of Return)
MIRR (Modified Internal Rate of Return)
Approximate project duration
Interpretation vs. your hurdle rate
Any relevant warnings (e.g., multiple IRRs)
What Is IRR?
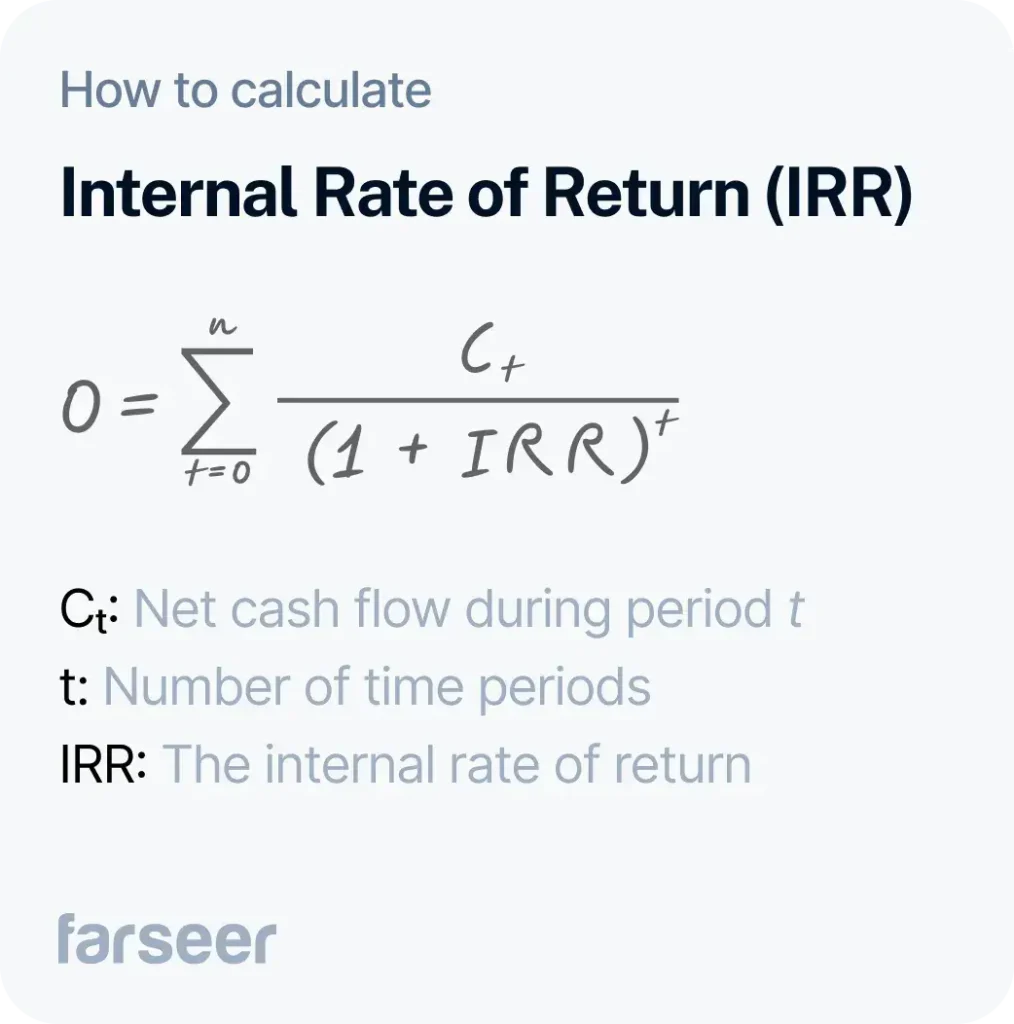
Internal Rate of Return (IRR) is the discount rate at which a series of cash flows has a Net Present Value (NPV) of zero.
In simple terms, IRR answers the question:
“What is the actual annual return of this project or investment?”
A project is usually considered attractive when IRR exceeds the company’s hurdle rate (or cost of capital). IRR is widely used for capital budgeting, project evaluations, private equity modeling, real estate analysis, and investment comparisons.
IRR vs. XIRR: Which One Should You Use
Understanding the difference between IRR and XIRR is essential for choosing the right method for your investment analysis. Although both metrics measure the return of a cash flow stream, they rely on different assumptions about timing – and that can significantly impact your results.
IRR (Equal Periods)
IRR assumes that all cash flows occur at perfectly even time intervals.
This means the investor expects money to come in once per period, most commonly once per year, quarter, or month, depending on how the model is set up.
When IRR Makes Sense
Use IRR when:
Your cash flows occur on a regular schedule
Timing is simple or standardized
The exact day of each cash flow doesn’t materially change the result
You’re performing high-level capital budgeting or project comparisons
Examples include:
Yearly project returns
Annual maintenance savings
Real estate developments with predictable stages
Comparing several opportunities across a portfolio
Because IRR uses even spacing, it’s quick to calculate and easy to interpret, but it may overlook timing nuances that affect the true rate of return.
XIRR (Actual Dates)
XIRR uses the exact calendar date for each cash flow, just like Excel’s popular XIRR() function.
This method allows the return calculation to reflect the real-world timing, including early payments, delays, uneven distributions, or lump-sum events.
When XIRR Is the Better Choice
Use XIRR when:
Cash flows occur on irregular dates
The exact timing has financial implications
You’re modeling real contracts, invoices, or milestones
You’re matching Excel outputs for consistency
Examples include:
Venture capital investments with unpredictable tranches
Projects with phased construction payments
Subscription or payment schedules not aligned to fixed periods
Any scenario where dates shift and must be measured precisely
Because XIRR accounts for uneven timing, it often produces a more accurate return metric, especially for complex or front-loaded/back-loaded cash flows.
What Is MIRR and When Should You Use It?
MIRR (Modified IRR) corrects many of IRR’s weaknesses.
It assumes:
Positive cash flows are reinvested at a chosen reinvestment rate
Negative cash flows are financed at a cost-of-capital rate
MIRR provides a more realistic measure for projects with unconventional cash flow patterns or multiple IRRs.
Interpreting Your Results
Once you calculate IRR (and optionally MIRR), the next step is understanding what those numbers actually mean for your investment or project. Use the following guide to make sense of the results and translate them into actionable insights.
Is IRR higher than your hurdle rate?
The hurdle rate represents the minimum acceptable return for your company or investment policy. It is often aligned with your WACC (Weighted Average Cost of Capital) or a target ROI set by management.
If IRR is higher than the hurdle rate:
The project is expected to create value. It means the investment returns exceed your cost of capital or your required rate of return.
This typically signals a green light for further evaluation or approval.If IRR is lower than the hurdle rate:
The project may destroy value. Returns are not sufficient to compensate for the risk or capital used.
This doesn’t necessarily mean the project must be rejected, but it should prompt deeper analysis, especially around strategic importance, externalities, or long-term positioning.If IRR equals the hurdle rate:
The project sits right at your minimum threshold.
This is usually a borderline case where qualitative factors or additional metrics (NPV, cash flow stability, risk level) become decisive.
Tip: IRR alone should never determine your decision. Always analyse NPV in parallel to understand the absolute value created, not just the rate of return.
How does MIRR compare to IRR?
MIRR (Modified Internal Rate of Return) accounts for realistic reinvestment rates of positive cash flows and the actual cost of financing negative cash flows.
Comparing the two can reveal important characteristics of your cash flow structure:
If MIRR is close to IRR:
Your project’s cash flows are relatively stable, and reinvestment assumptions don’t significantly distort results.
This suggests the IRR is a reasonably accurate reflection of the project’s economics.If MIRR is significantly lower than IRR:
This is often a red flag.
It indicates that IRR may be overstating the true return because IRR implicitly assumes reinvestment at the IRR itself – a rate that is frequently unrealistic in real markets.
MIRR often provides a more conservative and reliable indicator in these cases.If MIRR is higher than IRR:
This typically occurs when early positive cash flows can be reinvested at a rate higher than the IRR.
This scenario is less common but highlights how reinvestment assumptions shape overall performance.
Bottom line:
When IRR and MIRR diverge, MIRR generally gives the more trustworthy picture of long-term returns.
Are there warnings about multiple IRRs?
Multiple IRRs occur when cash flows change signs more than once, for example:
A project that starts negative, becomes positive, turns negative again
Investments with reinvestments, recalls, or cleanup costs late in the project
Real estate developments with major end-of-project expenses
Venture-style funding with irregular negative tranches
In these cases, IRR becomes unreliable because it produces multiple mathematically valid rates of return. The calculator will warn you if such a pattern is detected.
When multiple IRRs exist:
Do not rely on IRR alone
NPV at your hurdle rate becomes the superior metric
MIRR often provides a stable, single return figure
Scenario analysis becomes important to unpack timing and risk
Example:
If a project has an initial investment (negative), produces profits (positive), but ends with a large environmental remediation cost (negative), there may be two or more IRRs, each telling a different story, none of which accurately represent the project’s economics.
Putting It All Together
A strong investment typically demonstrates:
IRR above your hurdle rate
MIRR that is consistent with IRR
Clear, single IRR with no sign-change complications
A positive NPV at the discount rate you use internally
A cash flow pattern that aligns with strategic priorities and risk tolerance
Using all these metrics together – IRR, MIRR, NPV, and timing analysis – creates a much more complete financial picture than relying on any single number.
How Farseer Helps You Go Beyond IRR

While this calculator gives you immediate insights into a single investment, Farseer helps finance teams handle everything that comes after:
Build dynamic, collaborative financial models
Consolidate budgets, forecasts, and what-if scenarios
Compare investment options across full planning cycles
Maintain version control and eliminate spreadsheet chaos
Automate rolling forecasts and variance analysis
Bring finance, departments, and management into a single planning environment
With Farseer, IRR becomes just the starting point. You can evaluate projects in context, linked to your operating plan, cash flow projections, and long-term strategy.
Book a demo and see how Farseer can tranform your financial planning.