
When finance leaders talk about agility, rolling forecasts usually come up. And for good reason: when markets, costs, and supply chains shift overnight, sticking to a static annual budget feels like driving with last year’s GPS.
Rolling forecasts promise to fix that. They give you an always-on view of the road ahead. But here’s the catch: without the right setup, they quickly become just another spreadsheet headache.
Read: Rolling Forecast – 101 Guide For Smarter Planning
So let’s walk through what makes rolling forecasts actually work, and how to avoid the common traps.
The Pitfalls (When Best Practices Are Missing)
Rolling forecasts sound great on paper, but here’s what we usually see in real life:
Overly complex models
Every line item gets forecasted, updates take weeks, and the process collapses under its own weight.
Data scattered across systems
ERP says one thing, BI another, and Excel files multiply like rabbits.
Excel fatigue
Slow, error-prone, and impossible to scale.
Low stakeholder buy-in
Forecasts built in a finance silo don’t reflect reality — so nobody trusts them.
If any of this feels familiar, you’re not alone. The good news? There’s a better way.
Rolling Forecasts Best Practices
1. Pick the right horizon & frequency
Rolling doesn’t mean “infinite.” Most companies extend forecasts 12–18 months beyond the current period. If you’re in a volatile industry, monthly updates might make sense. If you’re more stable, quarterly can work. The trick is finding the sweet spot: frequent enough to stay relevant, but not so frequent it burns everyone out.
2. Focus on drivers, not details
You don’t need to forecast every office supply purchase. Rolling forecasts shine when you zoom in on key business drivers – things like headcount, sales volume, or market share. Keep it simple, and let those drivers cascade through your model. That’s how you avoid “forecast fatigue.”
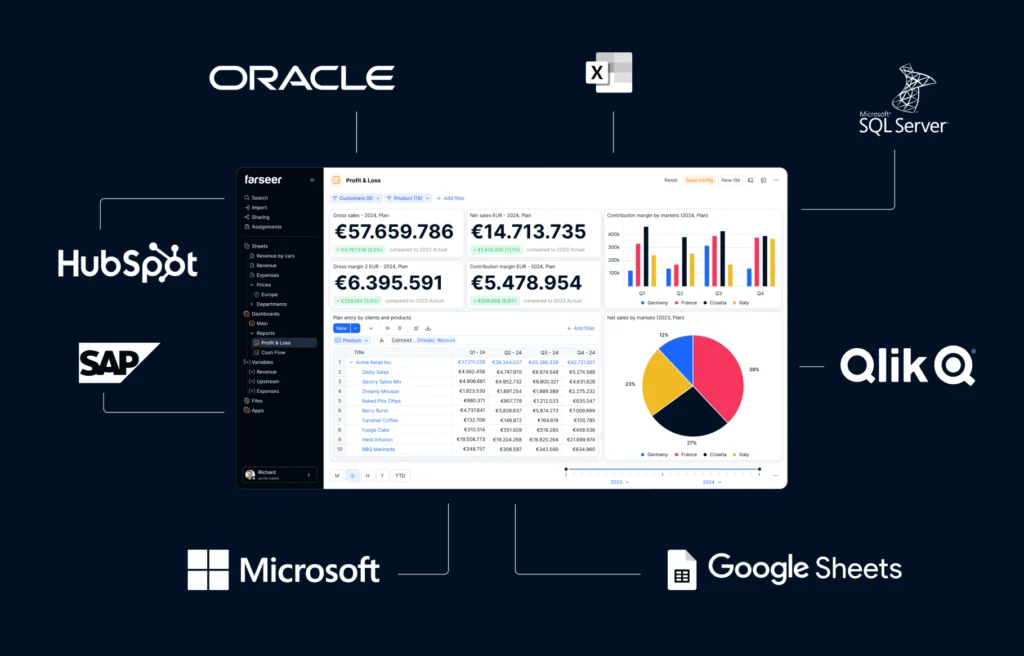
3. Integrate your data
Forecasting shouldn’t feel like detective work, chasing down numbers from ERP, CRM, BI, and half a dozen Excel files, each claiming to be “the truth.” When every department runs on its own data set, finance ends up stuck in reconciliation mode instead of actually analyzing and advising the business.
The fix is simple in theory (though tricky in practice): integration. When ERP, CRM, HR, and BI systems feed into a single model, you finally have one version of the truth. That means:
- No more manual copy-paste marathons. Updates flow in automatically.
- Numbers you can actually trust. Finance doesn’t have to double-check every figure because everything’s aligned at the source.
- Time back for strategy. Instead of reconciling spreadsheets, you’re running scenarios and supporting decisions.
And here’s the kicker: integration doesn’t just save hours. It dramatically reduces the risk of embarrassing mistakes, like presenting outdated revenue numbers in a board meeting or missing a material cost spike because ops and finance weren’t on the same page.
When your data is connected, rolling forecasts stop being a patchwork of guesses and start being a reliable compass for the business.
4. Get the business involved
A forecast built in isolation is a forecast nobody trusts. Sales, supply chain, and operations all bring insights finance can’t see from spreadsheets alone. Involving them not only improves accuracy, it also builds buy-in.
5. Use tech to automate the heavy lifting
Excel has been the finance world’s safety blanket for decades. And yes, it’s flexible, familiar, and powerful in the right hands. But when it comes to rolling forecasts, it shows its limits fast: formulas break, files balloon to hundreds of MBs, recalculations crawl, and suddenly the whole team is spending more time fixing spreadsheets than forecasting the business.
Modern planning platforms flip that dynamic. They’re built to handle the complexity Excel can’t:
- What-if simulations in seconds. Want to test how a raw material price hike, new market launch, or lost tender would hit your P&L? Instead of rebuilding formulas, you just plug in the change and see the ripple effect instantly.
- Automated updates. Data from ERP, CRM, and BI flows in without the manual copy-paste. That means your forecast is always based on the latest numbers, not last week’s exports.
- AI and machine learning that spot patterns you might miss. Predictive models can surface early signals, like a revenue trend shifting or costs creeping up, before they’re obvious in the raw data.
The payoff is massive: your team spends less time babysitting spreadsheets and more time doing the work leadership actually values: analyzing scenarios, advising on strategy, and helping the business make smarter calls.
6. Keep challenging your assumptions
Markets shift, assumptions age. A rolling forecast is only as good as its drivers, so keep testing: Are your growth rates still realistic? Do your cost assumptions reflect inflation? Regular calibration makes the forecast a living, breathing tool, not just a static file with a “rolling” sticker slapped on.
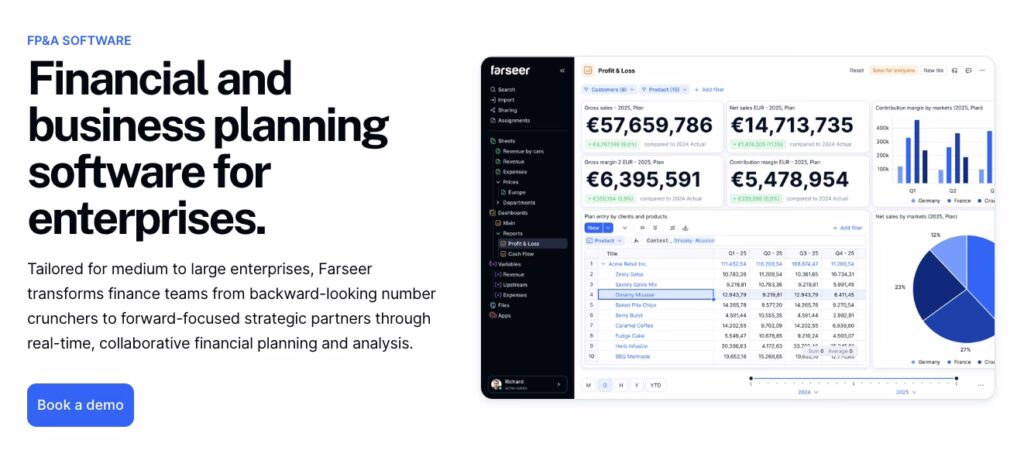
Where Farseer Fits In
If you’ve ever tried to run rolling forecasts in Excel, you know the pain: broken links, slow recalculations, and late-night hunts for which tab is “the real version.” That’s the exact chaos Farseer was built to eliminate.
Here’s how we make rolling forecasts faster, cleaner, and more reliable:
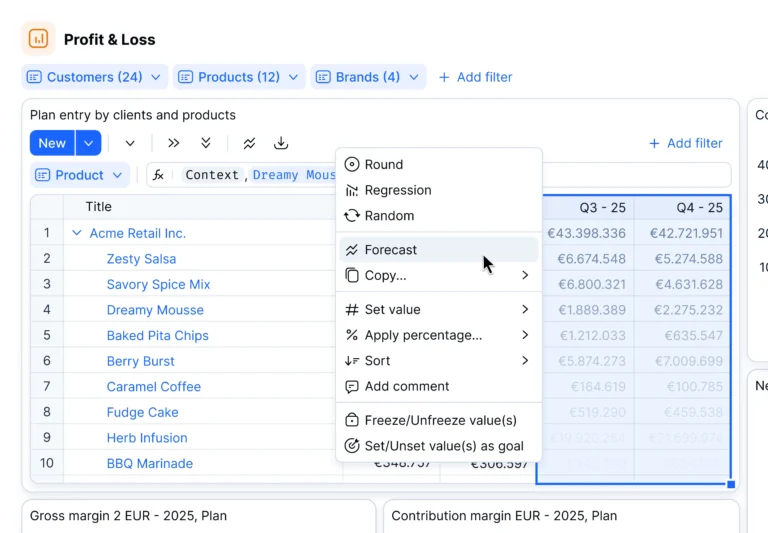
- One connected model – not a spreadsheet graveyard. Instead of juggling dozens of files, everything lives in a single governed model. ERP, BI, and CRM data flow in automatically, so you can stop wasting hours on reconciliation and version control.
- Driver-based forecasting baked in. You don’t have to hard-code every assumption into endless formulas. Farseer lets you define the few drivers that really move the business, like sales volume, headcount, price changes, and watch them cascade across P&L, Balance Sheet, and Cash Flow.
- Automation & what-if simulations that save weeks. Update cycles that used to take days or even weeks now happen in hours. Want to test the impact of losing a tender, or see how a 5% raw material increase hits margins? Run the scenario instantly before decisions are made, not after.
The result? Forecasts that are faster, more accurate, and more trusted.
And it’s not just theory. Companies like JGL Pharma (who cut consolidation time in half across 60+ markets) and Altium (who shortened forecasting cycles by 25%) have already made the switch.
With Farseer, rolling forecasts stop being a mechanical chore and start becoming the finance team’s secret weapon for agility and credibility.
Wrapping Up
Rolling forecasts are powerful, but only if they’re done right. Focus on the essentials, integrate your data, bring the business along, and lean on the right tech. Do that, and your forecasts will stop being a chore and start being a strategic advantage.
Curious how this looks in practice? Check out our case studies or book a quick demo – we’ll show you how other finance teams are making rolling forecasts actually roll.