
Variance analysis is supposed to explain what happened.
In practice, it often just confirms that something went wrong.
So the numbers are off, that part is obvious. What’s not is why. And a lot of the time, it comes down to the tool behind the numbers. Some tools stop at the variance. Others help you understand what actually changed.
In this text we’ll talk about six variance analysis software options finance teams commonly use today, and how well each one supports that next step, from spotting the variance to explaining it.
Excel
Excel is still the default starting point for variance analysis. It’s familiar, flexible, and available to every finance team from day one. For many organizations, variance analysis begins, and often stays, in spreadsheets because they allow teams to build exactly what they need, when they need it.
Key features
- Fully customizable variance calculations
Finance teams can define their own formulas, structures, and logic, from simple budget vs actual comparisons to more detailed breakdowns. - Easy ad-hoc analysis
When a question comes up, Excel makes it easy to quickly slice the data, add a column, or test a new calculation without waiting on tooling changes. - Universal familiarity
Almost everyone in finance knows how to use Excel, so teams can get up and running quickly.
Limitations
- Manual data updates and error risk
Variance analysis in Excel often relies on manual data pulls, copy-pasting, and refreshes, which brings in risk and slows things down. - Logic becomes hard to manage at scale
When models grow, formulas become complex, assumptions get hard to find, and it becomes harder to understand or change how variances are calculated. - Version control and collaboration challenges
Multiple files, multiple versions, and unclear ownership make it difficult to maintain a single source of truth.
Best for
Small teams or early-stage finance functions where variance analysis is relatively simple and speed matters more than scalability or governance.
Read: How to Calculate Flexible Budget Variance – No Complex Formulas

NetSuite (ERP Variance Reporting)
NetSuite includes built-in variance reporting that compares budgets and actuals directly within the ERP. Because the data comes straight from transactional systems, these reports are often the starting point for understanding financial performance at period close.
Key features
- Native access to actuals
Variance reports are tied directly to transactional data, reducing the need for manual data pulls or reconciliations. - Standard financial variance reports
Out-of-the-box reports support common comparisons such as budget vs actual by account and cost center. - Strong data integrity and controls
Centralized data, permissions, and audit trails help ensure consistency and reliability.
Limitations
- Fixed report structures
Variance views are largely predefined, making it difficult to adjust analysis as questions evolve. - Limited dimensional and driver-based analysis
Exploring variances by operational drivers like volume, price, or mix typically requires exporting data to another tool. - Not designed for investigation
NetSuite reports show where variances exist, but offer limited support for digging into why they occurred.
Best for
Financial control and basic variance tracking, especially for teams that want quick, reliable budget vs actual reporting directly from their ERP.
Farseer
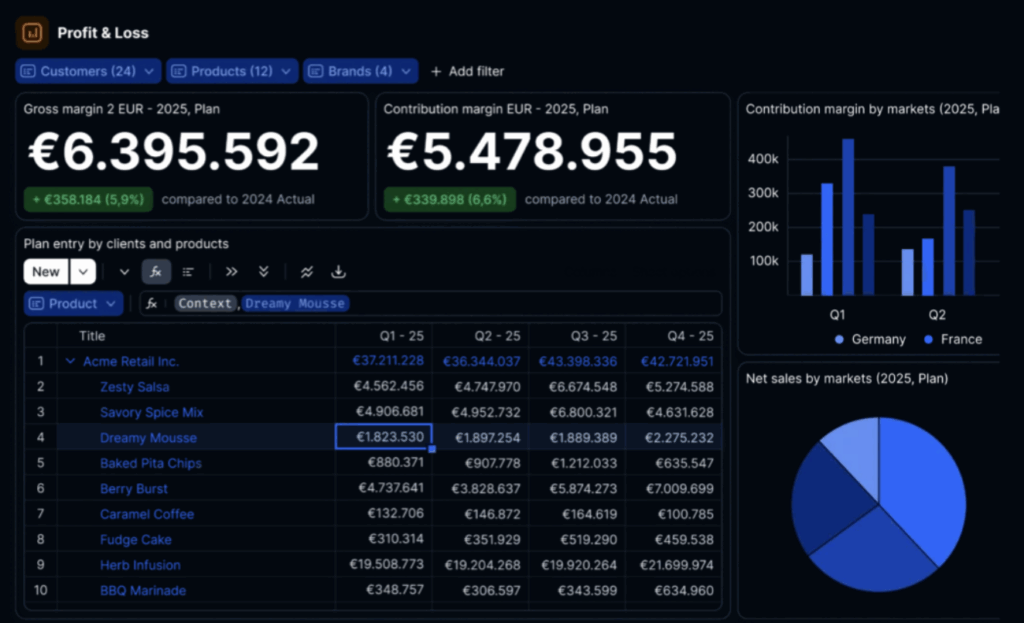
Farseer is a planning-first platform where variance analysis is built directly on live forecasting models. Instead of treating variance analysis as a separate reporting step, Farseer connects actuals, forecasts, and scenarios in one shared model, so analysis always reflects how the business is currently being planned.
Key features
- Variance analysis on the same model used for planning and forecasting
Actuals are compared against the same logic, drivers, and assumptions used in forecasts, reducing reconciliation and confusion. - Real-time exploration of drivers and assumptions
Users can drill into variances by volume, price, mix, or custom drivers and see how changes flow through the model instantly. - Chat-based interaction for faster investigation
Instead of rebuilding reports, users can ask questions in plain language and explore variances interactively. - Continuous comparison against rolling forecasts and scenarios
Variance analysis isn’t tied to a single static budget. Teams can compare results against updated forecasts or alternative scenarios as conditions change.
Why it stands out
Most tools treat variance analysis as something you do after the numbers are closed. Farseer treats it as part of the decision loop. By keeping planning, forecasting, and variance analysis on a single live model, teams spend less time reconciling numbers and more time understanding what changed, and what to do next.
Best for
Finance teams moving toward continuous planning who need faster variance explanations and shorter decision cycles, especially in environments where forecasts change frequently.

Power BI
Power BI is commonly used to visualize variances across financial and operational metrics. For many teams, it sits on top of existing data models and provides a clear, shareable view of where performance is above or below plan.
Key features
- Interactive dashboards
Users can explore variances through filters, drill-downs, and visual interactions without changing the underlying data. - Flexible visual slicing by dimension
Variances can be viewed by account, region, product, or other dimensions, as long as those dimensions are already modeled. - Strong integration with the Microsoft data stack
Power BI connects easily with Excel, SQL, and other Microsoft tools, making it a natural choice for teams already in that ecosystem.
Limitations
- Variance logic must be predefined
Calculations and comparisons need to be built in advance, which limits flexibility when new questions arise. - Limited support for planning assumptions
Power BI focuses on visualizing results, not capturing or adjusting the assumptions behind them. - Investigation depends on the underlying model
How deep users can go is determined by how the data model was built, often requiring analyst support for changes.
Best for
Monitoring and communication, especially for sharing variance visibility with stakeholders, rather than hands-on variance investigation.
Workday Adaptive Planning
Workday Adaptive Planning is a widely used FP&A platform that includes built-in variance analysis as part of its planning and reporting workflows. It’s often used by finance teams that run structured budgeting and forecasting cycles and want consistent comparisons between plan, forecast, and actuals.
Key features
- Budget, forecast, and actuals comparisons
Adaptive supports standard variance analysis across different planning versions, making it easier to track performance against expectations. - Multi-dimensional planning models
Financial data can be modeled across accounts, cost centers, products, and other dimensions. - Structured financial workflows
Approval processes, versioning, and controls support consistency across planning and reporting.
Limitations
- Variance analysis tied to planning cycles
Analysis is often aligned with formal planning or forecast updates, rather than continuous investigation. - Investigation can require analyst support
Ad-hoc questions or deeper variance exploration may require model changes or additional setup. - Commentary and explanation handled separately
Explanations often live in reports, decks, or external documents rather than directly in the analysis.
Best for
Organizations with established planning processes that value structure, governance, and consistency across planning cycles.

Anaplan
Anaplan is an enterprise-grade planning platform designed to support complex, multi-dimensional models across finance and the wider organization. It’s often used for large-scale planning and performance management, including variance analysis across many business units.
Key features
- Highly configurable modeling
Anaplan supports complex calculations and relationships across large data sets, enabling detailed variance analysis. - Strong dimensional flexibility
Users can analyze variances across multiple hierarchies, products, regions, and scenarios. - Enterprise scalability
Built to support large organizations with multiple stakeholders and high data volumes.
Limitations
- High implementation and maintenance effort
Building and maintaining models often requires significant setup and specialist expertise. - Slower ad-hoc variance investigation
Answering new questions can require changes to the model rather than quick exploration. - Steep learning curve for business users
Many users rely on dedicated model builders for ongoing changes and analysis.
Best for
Large enterprises with complex planning needs and dedicated teams to manage and maintain planning models.
Choosing the Right Variance Analysis Software
There’s no single “best” variance analysis tool. Each of these options supports variance analysis in a different way, and the right choice really depends on how your team works. How fast do you need answers? How often do your forecasts change? And how closely is variance analysis tied to planning and decision-making?
If variance analysis is still mostly about looking back, almost any of these tools can get the job done. But for teams trying to move past static reports and understand change as it’s happening, more modern platforms like Farseer take a more connected, forward-looking approach.
Wanna try it out?
FAQ
Variance analysis compares actual financial results to budgets, forecasts, or plans to understand where performance differs and why those differences occurred.
Many tools stop at showing the variance itself without helping users investigate underlying drivers like volume, price, mix, or changing assumptions.
Excel is familiar, flexible, and allows quick ad-hoc analysis. However, it relies heavily on manual data updates and becomes difficult to manage at scale.
Key limitations include manual data handling, high error risk, poor version control, and increasing complexity as models grow.
Farseer connects variance analysis directly to live planning and forecasting models, allowing teams to explore drivers and assumptions in real time.
Farseer supports rolling forecasts, scenario comparisons, and interactive driver analysis, helping teams understand changes as they happen rather than after close.
Yes. NetSuite offers built-in variance reporting that compares budget and actuals directly within the ERP using transactional data.
NetSuite reports are largely predefined and offer limited flexibility for driver-based or investigative variance analysis.
Power BI is commonly used to visualize variances through dashboards and reports, making it effective for monitoring and communicating performance.
Variance logic must be built in advance, and deeper investigation depends on how the underlying data model was designed.
Workday Adaptive Planning is used by organizations with structured budgeting and forecasting cycles that value governance and consistency.
Variance analysis is often tied to formal planning cycles, and deeper ad-hoc investigation may require analyst support or model changes.
Anaplan is best suited for large enterprises with complex, multi-dimensional planning needs and dedicated model management resources.
Answering new questions often requires changes to the underlying model, and many users depend on specialist model builders.
No. The best tool depends on how frequently forecasts change, how quickly insights are needed, and how closely variance analysis is tied to decision-making.
Teams should consider modern tools when they want to move beyond static, backward-looking reports and understand performance changes in real time.